Wednesday, December 29, 2021

Publications, Metrics and Reputation

 Here is an email I sent to my students about publications and reputation based on a recent paper that just appeared online.  I have removed names to conceal the names of parties that might prefer to remain anonymous.

Dear all,

A conversation about publications often comes up between graduate students and their research mentors.  I know that we have talked about this multiple times.  A valid concern of many students is the strength of their publications record, which is used by future academic employers.  It is easy to count numbers of publications or metrics such as the h-index, but an individual’s reputation is based on substance not simplistic numbers.

First, the research itself must be interesting and useful to others.  There are many papers that wow me even if I never cite them in my own research, winning my highest respect for those who create such gems.  You should work hard and enjoy the process of making new discoveries, and then hold yourselves to the highest standards for the work that you produce.  This is what will open doors to future employment.

The email below from one of my colleagues serves as an example of the reputation that you should seek to build over time.  I hope that this kind of feedback motivates you to persevere through the next phase of your work.  I certainly look forward to all the new insights that we will gain.

To conclude, I congratulate you for your contributions to this work.  I know that some of you were frustrated having to rebuild experiments, repeat measurements, and rewrite the manuscript an endless number of times as we found errors in the calculations and problems with the apparatus.  But in the end, I am proud of the final product, which I believe will be of use to others.

Happy New Year!


Best,

Mark G. Kuzyk

Regents Professor of Physics

Washington State University

Pullman, WA 99164-2814


Phone: 509-335-4672

Fax: 509-335-7816


Web Page: www.NLOsource.com


From: [Colleague]
Sent: Wednesday, December 29, 2021 9:11 AM
To: Kuzyk, Mark G <kuz@wsu.edu>; Mark G. Kuzyk <mgk.wsu@gmail.com>
Subject: Fwd: [Applied Sciences] Manuscript ID: applsci-1500266; doi: 10.3390/app12010315. Paper has been published.

Dear Mark,

I forwarded this new paper to my group members. You never cease to amaze me with the thoroughness and rigor of your research. What an amazing piece this last report is! We have a lot to learn from you, indeed.

I will enjoy reading the paper. I hope we can meet up at some point to continue our discussions. [My senior student] will be graduating in January and he wants to pursue a career in the corporate world. I have another student who is a bright and enthusiastic, and we can consider sending him to your lab, if the things with the pandemic get better.

Take care of your health,

[Colleague]

---------- Forwarded message ---------
From: Applied Sciences Editorial Office <applsci@mdpi.com>
Date: Wed, Dec 29, 2021 at 5:02 PM
Subject: [Applied Sciences] Manuscript ID: applsci-1500266; doi: 10.3390/app12010315. Paper has been published.
To: Colleague
Cc: Applied Sciences Editorial Office <applsci@mdpi.com>, Keira Wang <keira.wang@mdpi.com>

Dear [Professor],


We are pleased to inform you that "Photothermal and Reorientational
Contributions to the Photomechanical Response of DR1 Azo Dye-Doped PMMA
Fibers" by Zoya Ghorbanishiadeh, Bojun Zhou, Morteza Sheibani Karkhaneh,
Rebecca Oehler, Mark G. Kuzyk * has been published in Applied Sciences as
part of the Special Issue Composite and Smart Materials: Theory, Methods and
Applications and is available online:

Abstract: https://urldefense.proofpoint.com/v2/url?u=https-3A__www.mdpi.com_2076-2D3417_12_1_315&d=DwIDaQ&c=slrrB7dE8n7gBJbeO0g-IQ&r=8Rjnp4aNhHPBrmgt9k4Q6f-pu3z01qzkXZBySmc4rd8&m=o0b_FSbvMnSOnSSq65_Iqvm2Lzwws_d1R8DePemMmvVRGF0JjKCizRgc6-aV4Ati&s=NKk5yL3BySXUrbhhOaPR0aUISAStEHsLXfIt9ZbVctk&e=
HTML Version: https://urldefense.proofpoint.com/v2/url?u=https-3A__www.mdpi.com_2076-2D3417_12_1_315_htm&d=DwIDaQ&c=slrrB7dE8n7gBJbeO0g-IQ&r=8Rjnp4aNhHPBrmgt9k4Q6f-pu3z01qzkXZBySmc4rd8&m=o0b_FSbvMnSOnSSq65_Iqvm2Lzwws_d1R8DePemMmvVRGF0JjKCizRgc6-aV4Ati&s=t6QVhD-mbZqQY846ZCCoE2JzF67xY6qSi5A7TOImY3k&e=
PDF Version: https://urldefense.proofpoint.com/v2/url?u=https-3A__www.mdpi.com_2076-2D3417_12_1_315_pdf&d=DwIDaQ&c=slrrB7dE8n7gBJbeO0g-IQ&r=8Rjnp4aNhHPBrmgt9k4Q6f-pu3z01qzkXZBySmc4rd8&m=o0b_FSbvMnSOnSSq65_Iqvm2Lzwws_d1R8DePemMmvVRGF0JjKCizRgc6-aV4Ati&s=KrUea9tNwtMeC4JC2sXiRHNYB_UMo3nUyRQqeZfdlq4&e=
Special Issue:
https://urldefense.proofpoint.com/v2/url?u=https-3A__www.mdpi.com_journal_applsci_special-5Fissues_composite-5Fsmart-5Fmaterials&d=DwIDaQ&c=slrrB7dE8n7gBJbeO0g-IQ&r=8Rjnp4aNhHPBrmgt9k4Q6f-pu3z01qzkXZBySmc4rd8&m=o0b_FSbvMnSOnSSq65_Iqvm2Lzwws_d1R8DePemMmvVRGF0JjKCizRgc6-aV4Ati&s=8xdNAgcPAFbBFvgIf7SzfgeGSZTqc2tWgqC4aTa4zB4&e=


Wednesday, December 22, 2021

New Insights into the Obvious

The number of posts I publish here tends to rise around the holidays, when demands on my time temporarily wane, giving me time to think about interesting topics and reflect on life.  I reread a post from a while back, which talked about my frustrations with the hectic nature of my job and my desire to spend more time on deeper thought.  Click here for that post.  My goal was to understand some of the deeper consequences of quantum mechanics and how it underpins thermodynamics/statistical mechanics.

I have approached this goal over the last half decade by rethinking the most basic foundations of quantum mechanics; those topics that students quickly leapfrog to progress to the next stage of solving real research problems.  I find the need to build my intuition by mulling over these basics, perseverating over them until the meaning infuses my brain.  Once it becomes second nature, I can build on these foundations.

In the process skimming through typical textbooks, I found that the connection between quantum mechanics and density operators is not well made.  So, I wrote a simple two-page manuscript with a simple example that illustrates the important facts and submitted it to the American Journal of Physics.  One of the reviewers stated, “Reading this very short and sweet manuscript taught me something about density operators that I did not appreciate before; something that seems vitally important for both students -and- the general interested physicist to understand…

“The main thing I learned by reading this manuscript is that the apparent classical mixture form of the density matrix -always- originates from a purely quantum effect - entanglement with the environment. I almost cannot believe that I did not appreciate that before - interaction with the environment is certainly presented as the main issue to be solved in any open quantum system textbook. But the formalism obscures this, and I think I had come away with the impression that at least in some cases, the density matrix was really just used to represent a classical mixture. The use of the simple example here makes it extremely intuitive and obvious, which I think is just as the authors intended. However, I suggest three changes that I think will make this manuscript even better...

I find AJP a wonderful journal, authored and read by people who enjoy learning and appreciate new insights or an unexpected twist on a well-worn topic.

At the other extreme, we just had a paper accepted that developed two different models of how light can affect the mechanical properties of matter and used these models to interpret experiments to determine the underlying mechanisms.

This break I plan on continuing my work on a new project related to quantum computing, which is particularly exciting to me because it will require learning a lot of new material.

Stay tuned!


Thursday, October 28, 2021

Conspiracy Theorist Peter McCullough

I had a relative send me a link to me about Peter McCullough's claims that the mRNA shots are dangerous.  I responded with my take.  There are many more excellent resources than me on the topic, which I provide a link to below my post.  Here is my quick response.


Sunday, September 19, 2021

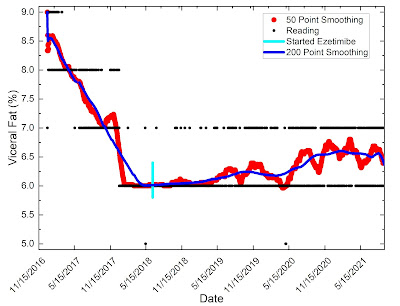
Self Test - Part II: the effect of ezetimibe on visceral fat


This post focuses on the power of smoothing, which is a process that picks out trends from noisy data.  We'll see that using a low-cost bathroom scale that has a visceral fat reading, we can see an observable effect that is correlated with the start of taking Ezetimibe, a cholesterol-reducing medication. 

My Yunmai bathroom scale provides a measure of visceral fat, that greasy stuff that lines our organs.  Higher percentages of it in our body increases risks of all sorts of diseases, so visceral fat is a good quantity to track and try to minimize.  The best way to reduce its percentage is to exercise to turn fat to muscle and to lose weight.

My scale has four electrodes, which are arranged in two pairs.  The left and right pair measure the resistance of the soles of each foot.  The resistance from one foot to the other measures the resistance of your body.  Combined with your weight and height, a formula is used to estimate the visceral fat.

I talked to an engineer at Cal Tech whose research was in the general area of biometrics, and she told me that such resistance measurements are related to the visceral fat, but they are not so accurate.  Furthermore, scales such as mine are biased towards the lower part of the body while those that use electrodes that you grasp in your hands is biased to the upper body.  So, corrections need to be made.

The bottom line is that I do not trust the absolute measurement but changes in the reading has some meaning provided that the scale is sensitive enough to detect the changes.  In my case, my reading ranges from 5 % to 9% percent as whole numbers.  The black points in the figure above show the visceral fat percentage as a function of date.  These points form horizontal lines at the whole numbers and alone give us very little useful information.

However, readings fluctuate between 8% and 9% at early times then between 7% and 8% and so on, implying that the visceral fat is falling with time.  Smoothing is the process of averaging adjacent points.  The red points show 50-point smoothing, where 25 consecutive points to the left of the data point and 25 to the right are averaged and plotted at the middle point of the range.  As a result, we get values between the whole numbers.  Suppose that my visceral fat is at 6.8%.  Then, the scale would read 7.0% more often that 6.0%, so the 50-point average would yield something around 6.8%.  Smoothing also eliminates day to day fluctuations that might hide the long terms trends.

The blue line shows 200-point smoothing, corresponding to over a half-year smoothing window.  This eliminates all but the most long-term trends.  The light blue vertical line in mid-2018 shows the date on which I started to take Ezetimibe, a medication that reduces cholesterol.  In my last post, I described how I used smoothing and a fit to a saturated exponential that found that my weight increased by 3 pounds after I started taking Ezetimibe.  The visceral fat data correlates with the observed weight gain.

To summarize the graph, smoothing shows my visceral fat falling from late 2016 and leveling off in early 2018 while I was on my high-fat diet.  This correlates with my weight loss.  Then, after taking Ezetimibe, my visceral fat started a long-term climb from 6% to about 6.5%.  Smoothing has allowed me to determine this rise to a precision that exceeds the whole numbers provided by the scale.

Finally, there is a dip in the 50-point smoothed curve that falls below 6%.  There is also one reading of 5% as seen by the black point.  The date corresponds to one week after my radical prostatectomy surgery and correlates with my initial weight loss then weight gain after the surgery.  Interestingly, the 200-point smoothed curve shows two plateaus – the first after starting the Ezetimibe and the second one after my prostate surgery.

As I have stressed in my past posts, this is a single experiment with potentially many confounding factors, so we cannot conclude that Ezetimibe increases visceral fat.  However, the result provides a hypothesis that could be tested with a larger number of participants.  Putting it all together, Ezetimibe drastically reduced my serum cholesterol (a huge effect that is consistent with controlled experiments) and is correlated with a small weight gain.  This added data shows that it might add to visceral fat.  This brings up the point that medications have complex effects on the body.  They work as intended to treat one condition, but the side effects might oppose some of the benefits.  In this case, the drop in cholesterol is far greater than the potentially ill effects of a small gain in visceral fat.

If there are others out there like me, pooling our data together could increase the confidence that the correlation is not a mere coincidence.  So give it a try!

Sunday, August 15, 2021

Self Testing - Part I

 Those of you who know me will not be surprised that I love data.  Even noisy data can bring a picture into focus if there is enough of it.  I collect data on all sorts of things but find biometrics fun because it’s easy to collect and it can potentially give useful insights.

A couple of previous posts alluded to some obvious trends that I have observed.  To all those people who mocked me decades ago for starting a low carb diet, contrary to their predictions that I would gain weight, I shed 50 pounds by eating mostly fat with a bit of protein and as few carbs as possible.  In the process, my cholesterol also dropped to healthy levels (see http://unknownphysicist.blogspot.com/2011/10/eating-lots-of-fat-to-lose-weight.html).  I kept my weight down for a decade.

After a trip to Belgium and then to Italy, I adopted a Mediterranean diet, which was a gateway to me eating lots of carbs again, which produced an upward spiral in my weight.  Then in 2012, when I had almost regained all the weight that I had lost, I went on a strict low carb diet for a second time.  Again, it worked, but over the last two years, I have struggled with a small weight gain, whose source I have tried to identify using my vast stores of data.

In the interim, PSA (prostate specific antigen) data that I had been tracking took off, as I described in my post describing my ordeal with prostate cancer. (see http://unknownphysicist.blogspot.com/2021/01/can-major-surgery-cure-depression.html and http://unknownphysicist.blogspot.com/2020/06/i-was-relieved-i-had-cancer.html)

The graph below shows my weight as a function of time.  There are a series of drops each followed by a plateau.  Also plotted are my measurements of total cholesterol and LDL cholesterol along with error bars that reflect the accuracy of my instrument.  LDL is the bad cholesterol.  My triglycerides were always very low, so I was not so concerned about my cholesterol while it slowly fell over 4 years (1500 days).  Then, for no apparent reason, my cholesterol shot up even as I was losing more weight.


Both my doctor and I got concerned with the rise, so he prescribed the highest dose of atorvastatin – which scrubs serum cholesterol.  My cholesterol remained high for months while taking it, so he sent me to a cardiologist, who suggested I add ezetimibe, which prevents cholesterol from being absorbed through the intestines.  I was reluctant to take ezetimibe because I had had a bad experience with Vytorin, which combines atorvastatin with ezetimibe.  I hadn’t realized how much energy Vytorin was sopping away (and resulting in weight gain) until I accidentally stopped taking it for a week.  I then regained my usual vigor.  That’s when I stopped Vytorin and went back to my strict diet.

My cardiologist suggested that I take an ultralow dose of Ezetimibe, which I did at the time shown by the vertical gray line in the plot.  Indeed, it drastically decreased my serum cholesterol, as you can see in the plots, and I retained my energy levels within my ability to notice.  And my weight appeared to remain stable, as shown within the gray dashed box.

The plot below shows a magnified view of my weight after starting to take Ezetimibe.  The raw data (points) is quite noisy and can vary by as much as 6 pounds over a few days.  That variation is real.  There are days when I exercise vigorously and might also dehydrate, so I could easily lose a few pounds, which I regain when hydrating and remaining sedentary for a few days.


The raw weight data does not appear to show any trends.  However, a plot of 50 (dark curve) and 100 point smoothed data (gray curve) shows a different story.  My weight appears to be increasing and it also fluctuates over time.  The fluctuations might also be real due to seasonal variations in my diet and activity.  The gray vertical dashed line falls on the date that I started taking Ezetimibe and the pink dashed line when I had prostate surgery.  Each seems to have been responsible for some weight gain.

Next I fit the raw data to saturated exponentials starting at the time I began my Ezetimibe regimen (light blue curve) and then after prostate surgery (magenta curve).   The fit shows that the Ezetimibe resulted in almost a 3 pound weight gain (when averaged over a couple months).  This is consistent with the fact that I observed a huge weight increase when I was taking a larger dose.  I gained a little less than two pounds after my radical prostatectomy.  Though minor, I have noticed a little edema around the incision area, so this increase is also explainable.

The skeptic might complain that the pink curve start lower than the flat part of the blue curve.  A closer examination of the data right after my surgery shows that my weight dropped by 5 pounds from the previous baseline for a week right after surgery, so that biases the early parts of the fit.  However, all of the fits and the smoothed data nicely follow each other aside from seasonal variations.

I would not conclude form my data that ezetimibe results in weight gain nor that prostate surgery does so too.  However, the data is suggestive that this might be the case and my data is consistent with secondary observations.  I find it amazing how such small effects can be drawn from the data and gives a small level of confidence that it might be true.

In the meantime, I continue to take and analyze the data to see if any other correlations emerge that might signal an interesting underlying cause.  Apologies for typos and the like, but my Fitbit just informed me that I missed my 250 step goal this hour while writing.  So I have to get up and walk...

Saturday, February 20, 2021

Facts should inform opinion

Opinions are open to debate, but scientific facts emerge from the scientific method after extensive debate between highly trained scientists.  Facebook posts, YouTube videos and editorials claiming the inefficacy of masks in mitigating virus transmission, denying anthropomorphic climate change, blaming vaccines for autism, and purporting adverse health effects of 5G rely on cherry-picked data to confirm biases, give credence to ideologues who are delusional or falsely claim expertise, advance conspiracy theories, and apply willful ignorance to credible evidence.

Reliable sources are non-partisan non-ideological experts in their fields who take pleasure in learning the truth and who publicly change their minds in light of new evidence.  Many career government employees fit the criteria, such as Dr. Fauci, who can be trusted to translate complex science to the public.  Serious journalists and geeky fact checkers, who carefully qualify their statements, can be found working for the major news outlets.  Facebook and Youtube, on the other hand, are populated with quacks, nutjobs and ideologues who spew nonsense that should be ignored.  Media outlets that provide only one political viewpoint are also untrustworthy.

In other words, Fox News argued that everyone knows that Tucker Carlson is not purporting to be reporting facts and his viewers know it.

Nightly programs on Fox News are unreliable.  As reported in the New York Times, a libel case against Fox was dismissed because: In reaching her decision (see tinyurl.com/Y55ecbvq), Judge Vyskocil relied in part on an argument made by Fox News lawyers that the “general tenor” of Mr. Carlson’s program signals to viewers that the host is “engaging in ‘exaggeration’ and ‘nonliteral commentary.’” The judge added: “Given Mr. Carlson’s reputation, any reasonable viewer ‘arrive[s] with an appropriate amount of skepticism’” about the host’s on-air comments.  In other words, Fox News argued that everyone knows that Tucker Carlson is not purporting to be reporting facts and his viewers know it.  Based on what I have read on these pages, many of you believe these programs and some act on the disinformation, like those who believe the lie that the presidential election was stolen and stormed the Capitol.

Turn to Scientific American magazine for trustworthy coverage of science and technology.  The authors are top scientists and journalists who are specialists in science and writing, and all articles are vetted for accuracy.   Errors in print that later come to light are promptly corrected, and a letters section offers informed exchanges.

Scientific American has published articles on COVID that show the physical structure of the virus, describe how scientific detective work found a bat cave in China where SARS-CoV-2 most likely originated, explain how the disease is transmitted, provide an appreciation for how researchers have learned its impact on the immune response through vast studies of samples collected from critically ill patients, etc.  Compare these nuanced narratives to those who arrogantly dismiss COVID as a hoax.
An article in the January 2021 issue of Scientific American describes how the number of COVID deaths determined from death certificates can be checked against excess deaths over the incredibly constant background death rate.  375,000 excess deaths were reported over the period from the first US COVID death through mid-November 2020 when US death certificates showed 250,000 lost lives due to COVID.  Researchers explain that these additional deaths are attributable to unreported COVID deaths and to preventable deaths from other causes that were untreated or under-treated because of stresses to medical resources during the pandemic.  So directly or indirectly, COVID has resulted in more deaths than reported.  If not COVID, what is the cause of these deaths?

So directly or indirectly, COVID has resulted in more deaths than reported.  If not COVID, what is the cause of these deaths?

Rather than debating the efficacy of masks – it’s been established that they reduce the spread, let’s debate our opinions on acceptable death rates.  Are some lives more valuable than others?  Let’s argue for appropriate levels of research funding.  The fast development of COVID vaccines relied on decades of research funded by the agencies that Trump consistently wanted to cut.  Let’s recognize the complexity of the world.  The choice is not between fighting COVID and saving the economy; the two are intertwined.  Let’s debate the right balance needed to attain the desired outcome and not allow ideology to stand in the way.  Let’s debate how much we should spend now compared with investing in the future to empower our children to deal with their challenges of climate change and future pandemics as our parents invested in us.  Let’s preserve our democracy by making the effort to learn the truth and base policies on facts, not lies.  Let’s accept Biden’s legitimate victory and move forward together.  And let's not fight over the facts, but instead, we would expend our energies on debating how best to implement solutions to the serious existential problems that are just around the corner.

Monday, January 11, 2021

Can Major Surgery Cure Depression?

The holidays are a good time to look back on our lives.  On this past Christmas eve, I was reading an article in the American Journal of Physics (AJP) on the topic of energy spectra for power-law potentials.  What a great coincidence that I had done this same calculation exactly a decade back, as I was reminded by a blog post from that time (see 2010 post).  I had not mentioned the details of the calculation in that post but was instead writing about how my wife Pat allowed me to isolate myself to work on this fun calculation while she and the rest of my family were preparing for our Ukrainian dinner.

At age 94, that would be my father’s last solo trip to Pullman, something I had expected at the time based on his cognitive decline.  Both our children were home for the holidays, waiting for the first visible star to appear, which would signal the time for our twelve-course Christmas Eve meal to begin -- a Ukrainian tradition that had been passed down through countless generations.

All morning, my father hovered over Pat in the kitchen to make sure that the cabbage was properly steamed, enough onions were sautéed for the butter topping and that the borsch had lots of garlic.  All the burners were on and the windows were painted in condensate that was crisscrossed by several rivulets that ended in miniature puddles on the windowsill.  Ukrainian Choral Christmas music blared over the speakers, drowning out the cooking sounds.  My father sang along with his rich operatic voice, with hands clasped behind him as he monitored the kitchen.  Our children were contacting old friends to plan for their yearly rendezvous at Ricos.  I was content in my calculations and secure in the presence of family.

My past posts consistently show the centrality of family and physics in my life.  Our families have grown -- both of our children with spouses and children of their own -- but I am now the father and the grandfather, taking the role of the patriarch.  My father briefly saw his first great grandchild (by Skype) just before he died in 2014.  Hopefully, I will see my own great grandchildren some day.

2020 was a year of illness and isolation.  I started the year by learning that I had prostate cancer.  My surgery coincided with the peak of COVID deaths in April (see link to the details).  It went well and the experience was a blip in the grand scheme of my life.  I kept busy writing papers (a couple which were accepted for publication in AJP and a massive review article that was accepted in the prestigious Advances in Optics and Photonics) and pondering new ideas, so my mind rarely wandered into the minefield of anxiety about my health.

PSA Data

My prostate surgery had other benefits.  I had been suffering with an undercurrent of depression since the passing of my father in December of 2014.  Though I had many reasons to be joyful since then, a deep-seeded darkness tugged at me, preventing me from feeling the unfettered happiness that was warranted by major events in my life.  This darkness lifted when I awoke from prostate surgery.  The experience reminded me of my mother’s depression years before she was diagnosed with cervical cancer.  Could it be that the human body signals the brain during a serious illness before other symptoms arise?  To investigate the plausibility of this hypothesis, I studied a plot of my Prostate Specific Antigen (PSA) test over time (see figure to the right).  Being measured as part of my yearly physical blood draw, my PSA data spans two decades.  In my younger years, the PSA data varied about the mean in a way that is characteristics of random noise.  But in 2014 (or perhaps as early as 2012), it started rising ever so slowly, following an exponential that a couple years ago pierced through to the level considered worrisome.  This proves nothing other than my depression being correlated with my father's death and the rise of my PSA.  But an intriguing correlation that my oncologist said he has independently observed...

My wife and I were isolated for most of 2020, but nevertheless we got COVID in November.  I traced

the probable location of my infection to the ice hockey rink, where I played masked with only 5 players. (The photo gives proof of us wearing masks -- but taken after I recovered from COVID).  Given the large separation between us, I was surprised that this was ground zero.  However, the  cold air and lingering breath droplets that it suspends, coupled with the heavy breathing associated with physical exertion no doubt made the ice a more dangerous place than I had expected.

We are fortunate that we had the mildest possible COVID symptoms and only for a short time.  I started feeling fatigue after playing ice hockey on a Sunday morning.  Most of the fatigue subsided after a 2-hour nap that afternoon after I had completed my weekend chores.  For the next couple days, I continued to feel mild fatigue, some achiness and had slight congestion that was comparable to what I normally experience from allergies.  I tested positive on the day after my symptoms appeared, and by Wednesday, I felt fine.  The only symptom that persisted for a couple weeks was the loss of the sense of smell, which returned gradually over time.

Overall, it was a good year, with the added benefit of the optimism I feel for 2021.

2021 has already started out well.  We visited my son, his wife and daughter on the other side of the country and also visited our daughter and her family.  Being immune to COVID (I tested positive for COVID antibodies) allows us to travel, so getting it was a net positive.  Also, I bought myself a nice Questar telescope (used on eBay), which I had coveted for decades, and plan to use it in our wilderness.  I will be teaching two graduate courses this spring, one of them a new prep (Thermodynamics), a topic that I am excited to revisit with the goal of deepening my understanding.  I am writing this post as I take a break from preparing my notes and doing the homework problems.

We will be using the thermodynamics textbook by Herb Callen, the professor that taught me the topic when I took his course at the University of Pennsylvania 40 years ago.  I recall the class being the worst in my graduate career – perhaps I was to blame.  But his book is fantastic, presenting the material clearly and resolving common points of confusion.  Working all the problems in the book consumes most of my time but doing so helps me to anticipate issues that students might have when learning the material.  And I am learning a lot through an enjoyable process of frustration followed by the satisfaction of success.

It is wonderful having a job that requires me to learn new things every day and a network of family and friends with whom I play and share my life.  Happy New Year!